Seasonal prediction of summer Artic sea ice extent
Over the recent years, the Arctic region has attracted considerable mediatic and
scientific attention. More specifically, the rapid decline of sea ice has profoundly re-
shaped the Arctic landscape and has opened multiple opportunities, from resource
extraction to shipping. As a result, the topic of seasonal Arctic sea ice prediction
has become a major scientific research question since about 10 years.
Research
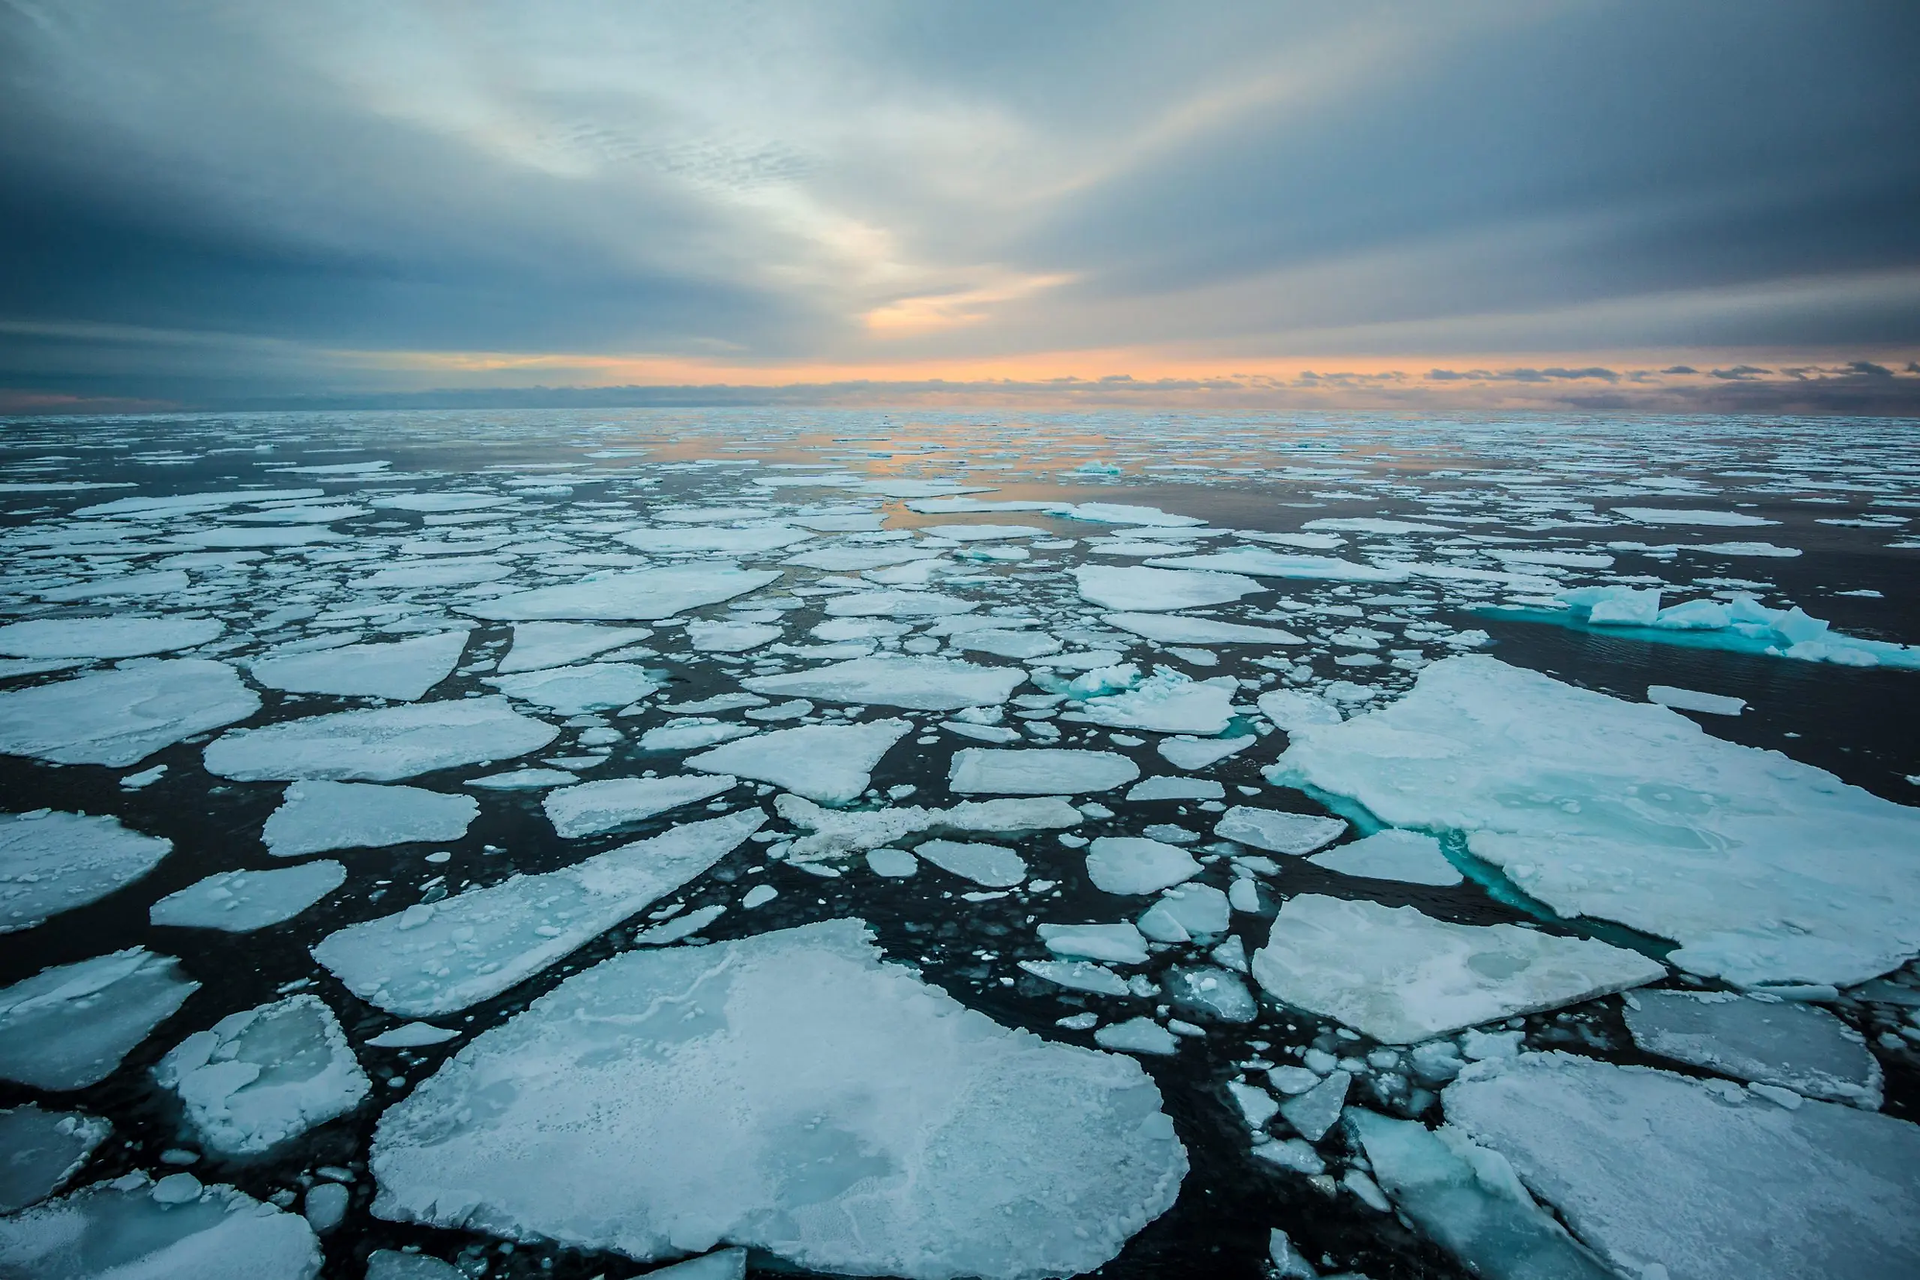
Opportunity for some, disaster for others, the anthropogenic warming has led to an unprecedented year-round reduction in Arctic sea ice extent (SIE). In particular, according to the NASA, since the first satellite measurements in 1979, September Arctic sea ice is now decling at a rate of 13% per decade, relative to the 1981 to 2010 average. This region of the Earth which is the most sensitive to this change, is attracting interest from more and more stakeholders. While all communities and ecosystems are suffering directly or indirectly, resource extraction companies, the maritime transport sector and the tourism sector are rejoicing in this sea ice melting. Therefore, the prediction of Arctic sea ice extent has become a social issue and not only an activity for the sake of the scientific research.
In this work, we will attempt to predict the Arctic sea ice extent in September 2022. To do so, a rugged forecasting system will be build based on monthly observation data from January 1979 to April 2022 from The European Organisation for the Exploitation of Meteorological Satellites (EU-METSAT) Ocean and Sea Ice Satellite Application Facilities (OSI SAF). The first step will be to use those data to May 2021 to generate a retrospective prediction for September 2021. Then, compare our model with the September 2021 data we already know. Finally, after testing the efficiency of our model, to predict the extension of sea ice by September 2022 using data until May 2022.
Mechanisms of sea ice predictability
Although predicting the Arctic sea ice cover at seasonal time scale is increasingly difficult as the thickness (Blockley & Peterson, 2018) of the ice decreases, there are several mechanisms that make it predictable with a certain level of precision (Chevallier et al., 2019). The main ones are the persistence or advection of sea-ice anomalies, interactions with the ocean and atmosphere and changes in radiative forcing (Guemas et al., 2016). The persistence of an anomaly represents the period in which the anomaly, i.e. the difference between the current state of the sea ice extent and the average of this extent over the past years for the same month, will survive. For instance in this project, due to the persistence, the average of the anomalies between October and May can be used to predict the SIE in September. Then, the atmospheric circulation (if predictable) can contribute to the predictability of the arctic sea-ice conditions. Subseasonal to interannual variability in the Arctic surface circulation is primarily wind driven (Chevallier et al., 2019). Moreover, ocean heat-flux convergence has a key role in determining the location of the winter sea-ice edge. In the Atlantic Sector, the ocean heat transport via the North Atlantic Current was highlighted as a chief cause of the sea-ice melting (Guemas et al., 2016).
Results
1
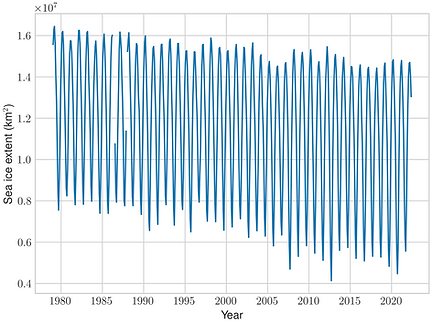
Seasonal variation of the SIE from 1979 to 2021
On this graph, the seasonal variations of the sea ice extent seem to have a general tendency to decrease along with an increase in the gap between annual highs and lows. In the following, a prediction of the September SIE is made and compared with its observed values corresponding to the annual minima.
2
Predicted september SIE

Methodology
The SIE data of every month from October to May has been used to make a prediction where it has been assumed that the mean anomaly of this period will persist until the next September. This method is not necessarily physically consistent, considering that the anomaly does not last more than a couple of weeks in general. After obtaining a naive prediction, a correction to the trend had to be applied because the anomaly of ice is underestimated from the October – May mean and then added to the precedent September mean. This effect is directly linked to the increasing gap between highs and lows that we saw on the whole SIE throughout the years. The figure shows the predicted September SIE where only past data has been used.
The predicted SIE for September 2022 : 5.147.032 km²
3
Verification
To verify the prediction, an event has been chosen to see if accordingly, it is predicted to happen or not and compare it with the observations. The event chosen is "an inferior September SIE will be lower than previous year". The last figure put into perspective the years where the event happened associated with the predicted probability of occurrence. A large probability in green means that the event was correctly predicted with confidence. Our model predicted particularly high probability for the event happening in 2022.
Predicted Probability: 90%
Methodology

Conclusion
Our prediction system is mainly based on the phenomenon of anomaly persistence. Even if at first sight this may seem poor as a hypothesis because of its quality over several months, we observe that for such an academic project, the results obtained are not too far from reality, which is quite satisfying. Indeed, a better quality of prediction would have involved to consider the dynamics of the atmosphere. Furthermore, our verification event was useful, it allowed us to adjust the prediction that was made. The BSS indicates that it is globally more helpful than the simple climatology. Eventually, we look forward to comparing our September 2022 SIE prediction with satellite data!
For comparison, a paper presenting Bayesian logistic regression for probabilistic predictions of minimum Arctic Sea ice extent in September was selected (Horvath et al., 2020). This study also evaluated its predictions using the Brier score. They found an average Brier score of 0.092 for the years 2009-2018 and 0.089 for 1990-1999. In our case, the BS is equal to 0.16. This should mean that our forecast is less skillful than them. This difference may be based on the methodology. Indeed, they took a period from 1980 to 2018. Atmospheric and oceanic variables were considered. Then a logistic regression was applied with these variables and with the sea ice data. Thus, it considers more variables than in the previous study and produces a more accurate forecast.
One way to improve this kind of prediction would be to use AI with the Convolution Neural Network (CNN) based models. Nevertheless, it is necessary to find a way to accurately verify the results since the way of setting the model is different from our simple anomaly persistent model. In fact, CNN based model needs a large set of data to train the model that cannot be used for verification
References
The code associated with this project can be found here: Github
[1] Blockley, E. W., & Peterson, K. A. (2018). Improving Met Office seasonal predictions of Arctic sea ice using assimilation of CryoSat-2 thickness. The Cryosphere, 12(11), 3419–3438. https://doi.org/10.5194/tc-12-3419-2018
[2] Chevallier, M., Massonnet, F., Goessling, H., Guémas, V., & Jung, T. (2019). Chapter 10—The Role of Sea Ice in Sub-seasonal Predictability. In A. W. Robertson & F. Vitart (Eds.), Sub-Seasonal to Seasonal Prediction (pp. 201–221). Elsevier. https://doi.org/10.1016/B978-0-12-811714-9.00010-3
[3] Guemas, V., Blanchard-Wrigglesworth, E., Chevallier, M., Day, J. J., Déqué, M., Doblas-Reyes, F. J., Fučkar, N. S., Germe, A., Hawkins, E., Keeley, S., Koenigk, T., Salas y Mélia, D., & Tietsche, S. (2016). A review on Arctic sea-ice predictability and prediction on seasonal to decadal time-scales. Quarterly Journal of the Royal Meteorological Society, 142(695), 546–561. https://doi.org/10.1002/qj.2401
[4] Horvath, S., Stroeve, J., Rajagopalan, B., & Kleiber, W. (2020). A Bayesian Logistic Regression for Probabilistic Forecasts of the Minimum September Arctic Sea Ice Cover. Earth and Space Science, 7(10), e2020EA001176. https://doi.org/10.1029/2020EA001176